
In today’s data-driven world, monitoring marketing performance is crucial for success. Businesses need to understand what’s working, what’s not, and how to optimize their campaigns for maximum impact. Utilizing the right analytics tools can provide invaluable insights into key performance indicators (KPIs) such as website traffic, conversion rates, customer behavior, and return on investment (ROI). This allows marketers to make informed decisions, refine their strategies, and ultimately achieve their business objectives. Choosing the right tools from the plethora of options available can be overwhelming. This article will explore the top analytics tools available to help you effectively monitor your marketing performance and gain a competitive edge.
This comprehensive guide will delve into the features, benefits, and pricing of various leading marketing analytics tools, catering to diverse needs and budgets. Whether you are a small business owner, a marketing manager, or a data analyst, understanding the capabilities of these tools is essential. We will cover tools that specialize in website analytics, social media analytics, search engine optimization (SEO) performance, email marketing analytics, and more. By the end of this article, you will have a clearer understanding of the top analytics tools at your disposal to effectively monitor your marketing performance and drive meaningful results.
Why Data Matters in Digital Marketing
In today’s digital landscape, data is the lifeblood of effective marketing strategies. Data-driven decision making empowers marketers to move beyond guesswork and intuition, enabling them to understand their target audience with unprecedented precision. By analyzing data from various sources, including website analytics, social media engagement, and customer relationship management (CRM) systems, businesses gain invaluable insights into consumer behavior, preferences, and purchasing patterns. This knowledge allows for the creation of highly targeted and personalized campaigns that resonate with specific segments of the audience, leading to improved conversion rates and a higher return on investment (ROI).
The benefits of data-driven marketing extend far beyond simply understanding the customer. Data analysis allows marketers to optimize campaigns in real-time, making adjustments based on performance metrics and emerging trends. This agility ensures that marketing efforts remain relevant and effective in the ever-evolving digital environment. Furthermore, data can be used to measure the success of campaigns accurately, providing concrete evidence of their impact on business objectives. By tracking key performance indicators (KPIs) such as website traffic, lead generation, and sales conversions, marketers can demonstrate the value of their work and identify areas for improvement.
Ultimately, data empowers marketers to make informed decisions, personalize customer experiences, and optimize campaign performance. By embracing a data-driven approach, businesses can gain a competitive advantage, build stronger customer relationships, and achieve sustainable growth in the digital marketplace.
Google Analytics vs GA4 vs Looker Studio
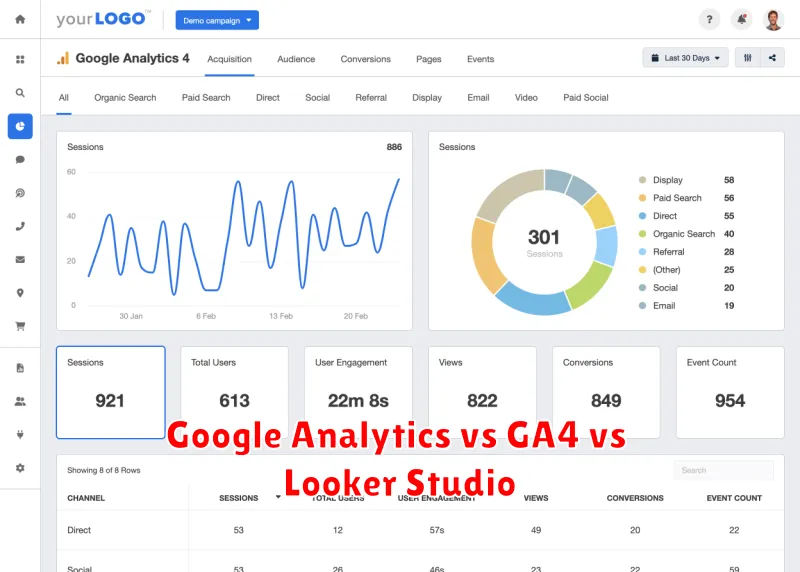
Google Analytics (UA) was the previous generation of Google’s web analytics platform. It focused primarily on website traffic from desktop devices and used cookies extensively for tracking. Key features included tracking pageviews, bounce rate, and conversions. While highly popular, it struggled to adapt to the changing digital landscape, particularly with the rise of mobile apps and increasing privacy concerns.
Google Analytics 4 (GA4) is the latest iteration of Google’s analytics platform. It represents a significant shift, moving towards event-based data collection and offering cross-platform tracking capabilities, unifying web and app data. GA4 uses machine learning to fill data gaps caused by cookie restrictions and focuses on user engagement and predictive metrics like churn probability and potential revenue. It also prioritizes user privacy and prepares businesses for a cookieless future.
Looker Studio (formerly Google Data Studio) is a data visualization and reporting tool that can connect to various data sources, including both Universal Analytics and GA4. It allows users to create interactive dashboards and reports to visualize key performance indicators (KPIs) and gain insights from their data. While both UA and GA4 have built-in reporting features, Looker Studio offers more flexibility and customization options for creating visually appealing and insightful reports. It’s a complementary tool to Google Analytics, not a replacement.
Heatmaps and Session Recording Platforms
Heatmaps and session recordings are powerful tools for understanding user behavior on websites and web applications. Heatmaps visually represent user interaction data, showing where users click, scroll, and move their mouse. This allows you to quickly identify popular areas, points of friction, and areas of interest on your pages. Session recordings, on the other hand, provide a playback of individual user sessions, revealing the exact sequence of actions they take. This allows for a deeper understanding of user journeys, identifying specific usability issues, and uncovering unexpected user behavior.
By combining these two tools, businesses can gain valuable insights into how users interact with their website. Analyzing heatmaps can reveal areas of high engagement and potential drop-off points, while session recordings can provide context and explain the “why” behind the observed patterns. This information is crucial for optimizing website design, improving user experience, and ultimately increasing conversion rates. For instance, a heatmap might reveal that users are not clicking on a call-to-action button, and the session recording might show that the button is obscured by another element on the page or difficult to find. This pinpointed insight allows for targeted improvements.
Several platforms offer combined heatmap and session recording functionalities. When selecting a platform, consider factors such as ease of use, the level of detail provided in the data, integration with other analytics tools, and pricing. These platforms offer valuable data that can inform data-driven decisions regarding website optimization and enhancing user engagement.
Real-Time Data Dashboards for Teams
Real-time data dashboards provide teams with up-to-the-minute insights, fostering faster, more informed decision-making. By displaying key performance indicators (KPIs) and other critical metrics in a visually accessible format, these dashboards empower teams to actively monitor progress, identify trends, and respond to changes swiftly. This immediate access to data eliminates the delays associated with traditional reporting methods, enabling proactive adjustments and improved overall efficiency.
Dashboards can be customized to meet the specific needs of various teams. Sales teams might track leads, conversions, and revenue, while marketing teams could monitor website traffic, campaign performance, and social media engagement. Regardless of the specific metrics, real-time dashboards provide a centralized view of vital information, facilitating better communication and collaboration within the team.
Implementing real-time dashboards offers several key benefits. Increased transparency, improved data-driven decision-making, and enhanced responsiveness are among the most significant advantages. Ultimately, leveraging real-time data empowers teams to achieve greater agility and effectiveness in today’s dynamic business environment.
Custom Reporting and KPI Tracking
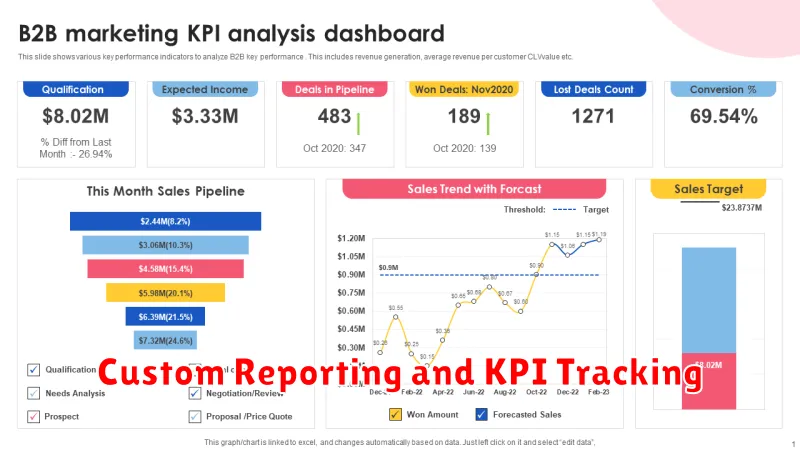
Custom reporting allows you to tailor reports to your specific business needs. You can choose the key performance indicators (KPIs) you want to track, the data sources you want to use, and the format in which you want to view the results. This flexibility allows for a deeper understanding of performance across various aspects of your organization. By analyzing these customized reports, you can identify trends, spot potential issues, and make data-driven decisions.
KPI tracking is essential for measuring progress and identifying areas for improvement. By establishing clear KPIs and monitoring them regularly, you can gain valuable insights into the effectiveness of your strategies. Tracking KPIs allows you to identify what’s working, what’s not, and adjust your approach accordingly. Regular monitoring enables you to stay agile and responsive to changing market conditions and business needs.
Effective custom reporting and KPI tracking work hand-in-hand to provide a comprehensive view of your business performance. The ability to tailor reports based on your specific KPIs allows for highly focused analysis and informed decision-making. Consistent monitoring ensures that you stay on track toward your goals and can quickly identify and address any deviations.
How to Choose the Right Tool Stack
Selecting the right tool stack is crucial for project success. Project requirements should drive your decisions. Consider factors like scalability, performance needs, security requirements, and the expertise of your team. For example, a small project with a limited budget might benefit from open-source tools, while a large enterprise project might require more robust, commercial solutions. Evaluating your project’s specific needs is the first step in making informed choices.
Next, research and compare available tools. Examine each tool’s strengths and weaknesses, paying close attention to community support, documentation, and integration capabilities. Consider the learning curve associated with each tool and whether it aligns with your team’s existing skills. Creating a shortlist of potential tool stacks based on your research can simplify the decision-making process.
Finally, test and evaluate your chosen tools through proof-of-concept projects or pilot programs. This hands-on experience will provide valuable insights into the tools’ practicality and effectiveness within your specific environment. Don’t be afraid to iterate and refine your tool stack based on the results. Choosing the right tools is an ongoing process, and continuous evaluation ensures your stack remains effective and aligned with project goals.